The American Association for the Advancement of Science (AAAS) is a prestigious scientific society that serves as an advocate for science and an organization promoting the advancement of scientific knowledge. Science, published by AAAS, is one of the world's leading peer-reviewed academic journals. It covers a wide range of scientific disciplines and is renowned for publishing groundbreaking research and discoveries across various fields of study.
Starting with a contract position as a Designer right after graduation, this opportunity unexpectedly transformed into one of the most incredible experiences of my career. Initially, I concentrated on photo editing, sourcing specific imagery for editorial stories and magazine layouts across various sections of the publication. However, my role gradually shifted towards a stronger emphasis on illustration, data visualization, and collaboration with journalists working across various scientific disciplines.
Starting with a contract position as a Designer right after graduation, this opportunity unexpectedly transformed into one of the most incredible experiences of my career. Initially, I concentrated on photo editing, sourcing specific imagery for editorial stories and magazine layouts across various sections of the publication. However, my role gradually shifted towards a stronger emphasis on illustration, data visualization, and collaboration with journalists working across various scientific disciplines.
Data Visualization
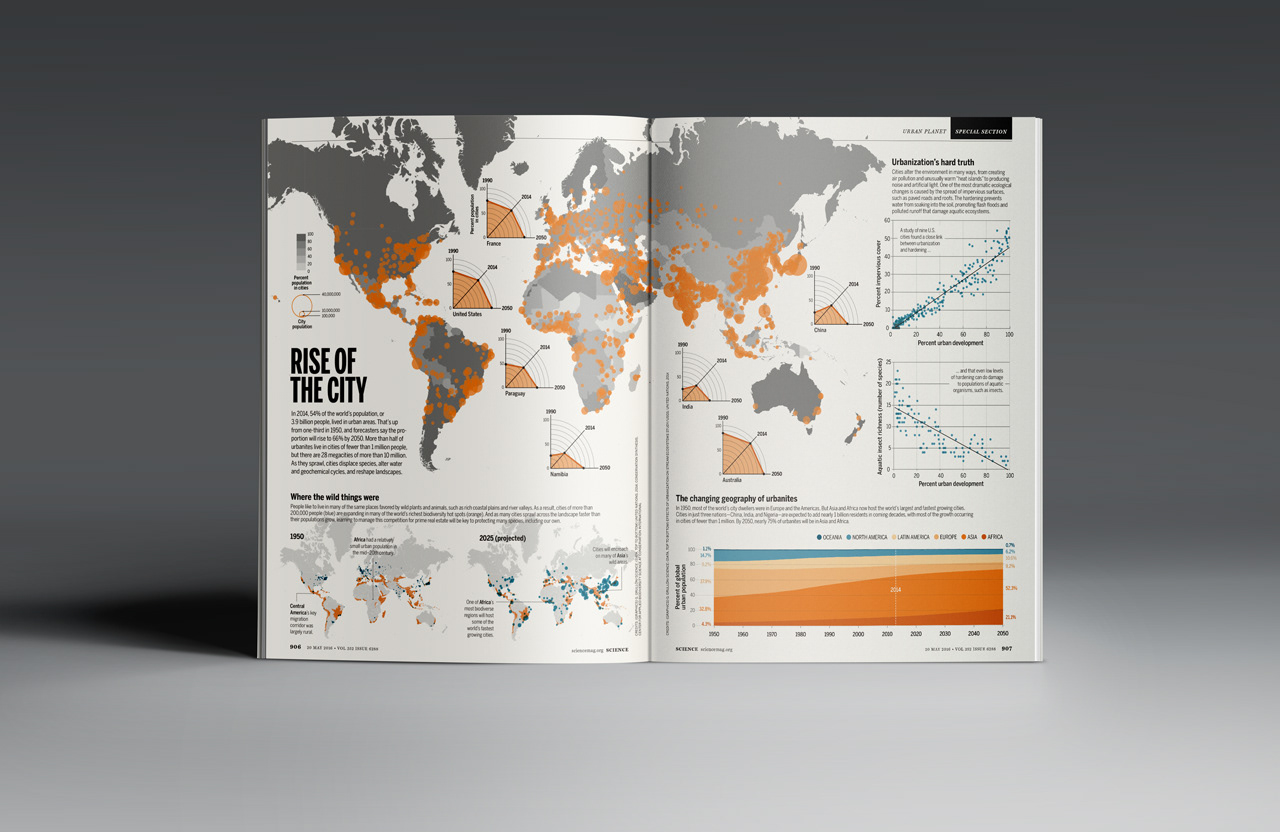
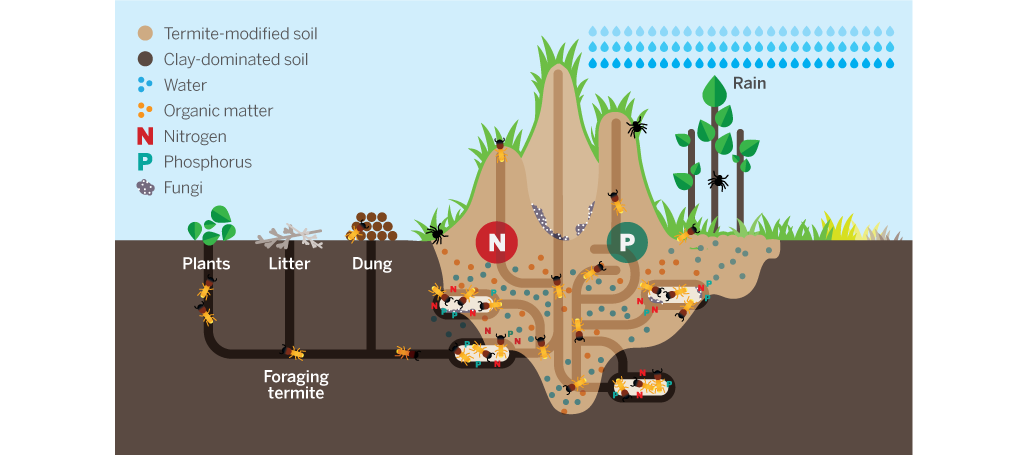
This spread served as the Intro page to a much deeper dive into how modern cities affect biodiversity in a Science special section called "Urban Planet".
Urban Planet
Science Special Issue
This is a graphic that I worked on for Science magazine in collaboration with story writer David Malakoff to reveal how rapid urbanization is currently effecting the world and what the trends in data are showing is yet to come.
Science Special Issue
This is a graphic that I worked on for Science magazine in collaboration with story writer David Malakoff to reveal how rapid urbanization is currently effecting the world and what the trends in data are showing is yet to come.
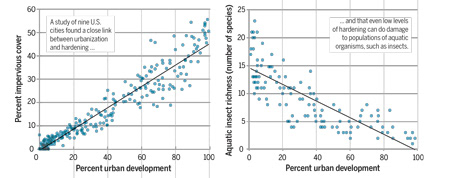
When we put all of the puzzle pieces together and cleaned up all of the data, what surfaced was that as towns and cities became more 'impervious', or covered their surrounding lands in substrates like pavement and cement, there was a sharp decline in surrounding aquatic insect populations.
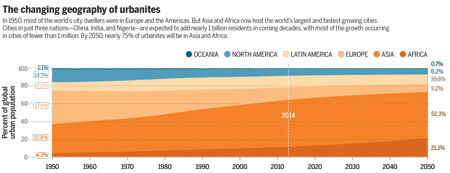
The data shows dramatic changes in urban populations. As towns evolve into large iterations of themselves and cities become mega cities, populations shifts will start to effect our day to day life all around the world.
Sci-Hub
Science Special Issue
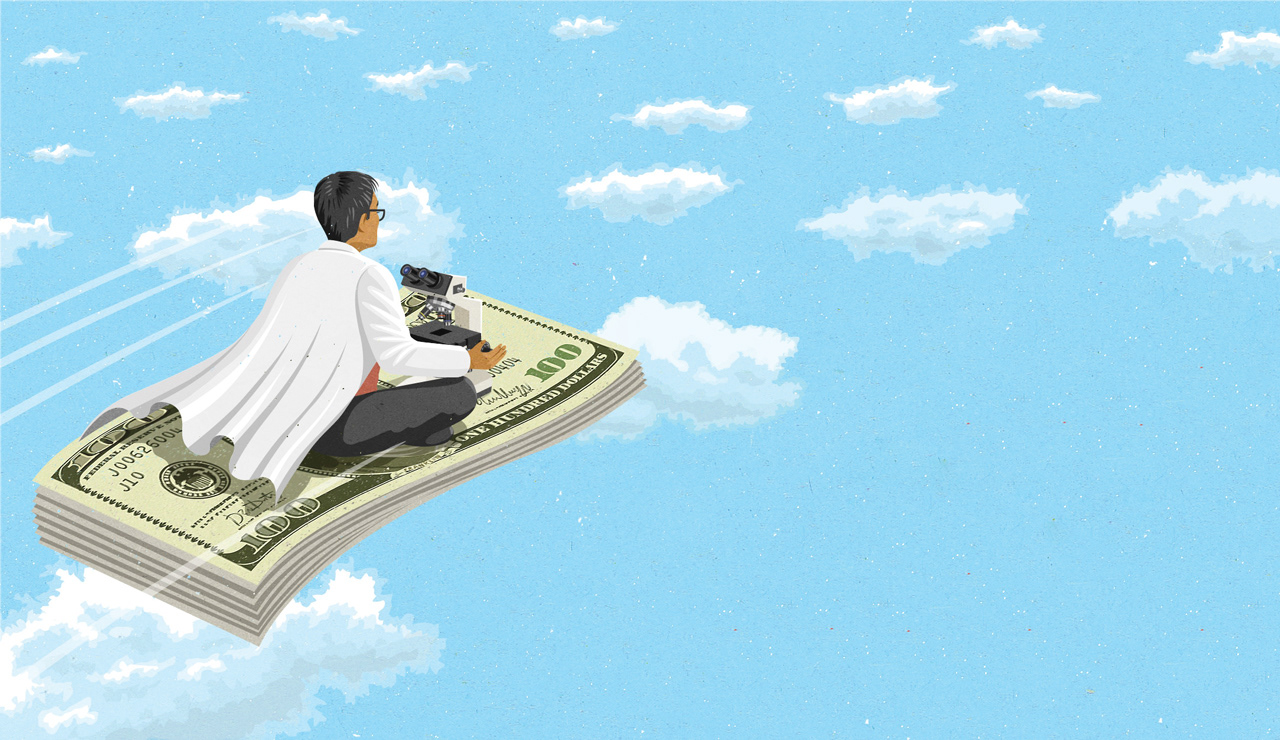
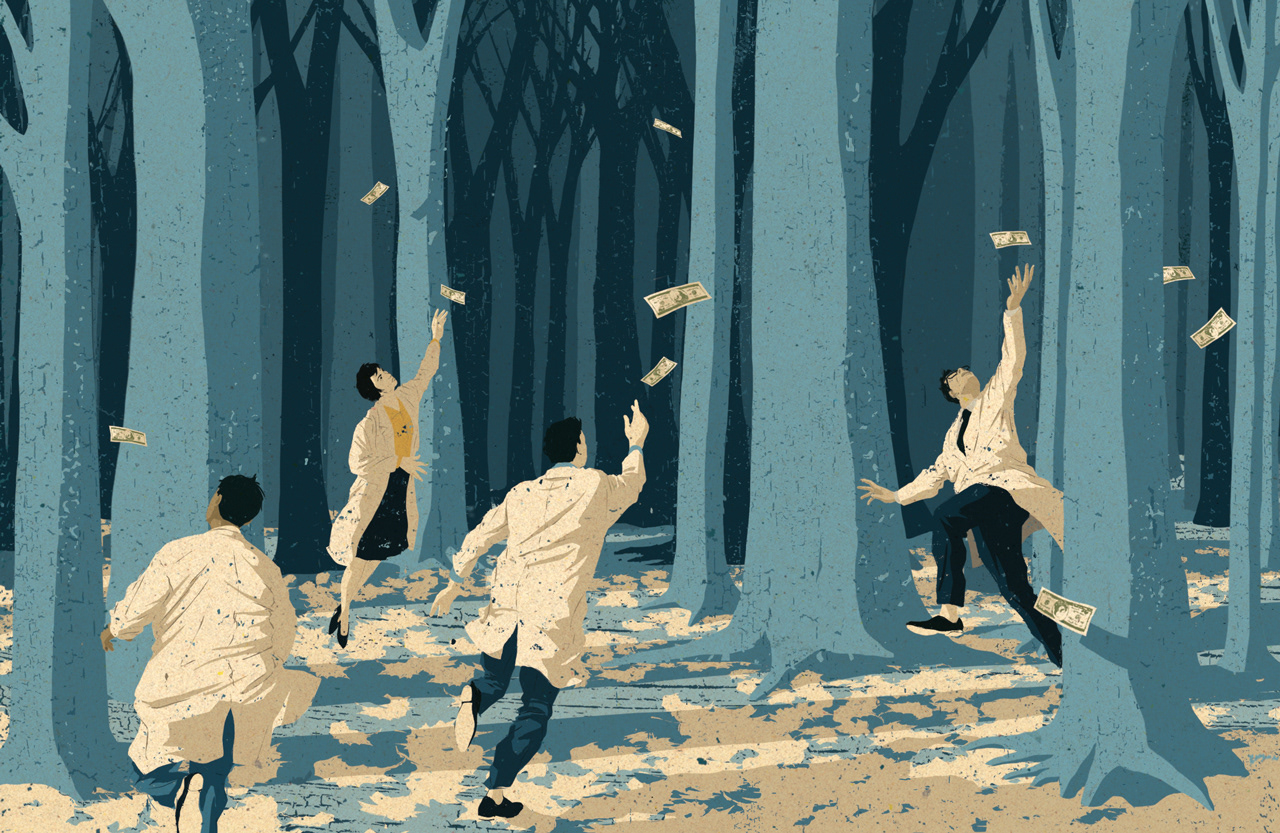
This is a layout and graphic that I worked on for Science magazine in collaboration with story writer John Bohannon to help expose Sci-Hub: a back channel where anyone with access could download academically peer-reviewed papers typically held behind a paywall. We wanted to investigate which countries were using the tool the most - and of course, what they were downloading.
Science Special Issue
This is a layout and graphic that I worked on for Science magazine in collaboration with story writer John Bohannon to help expose Sci-Hub: a back channel where anyone with access could download academically peer-reviewed papers typically held behind a paywall. We wanted to investigate which countries were using the tool the most - and of course, what they were downloading.

John understood that the data is where all of the information we wanted to highlight was going to be found. Together, we parsed through and cleaned up millions of records to help identify the points we wanted to make.
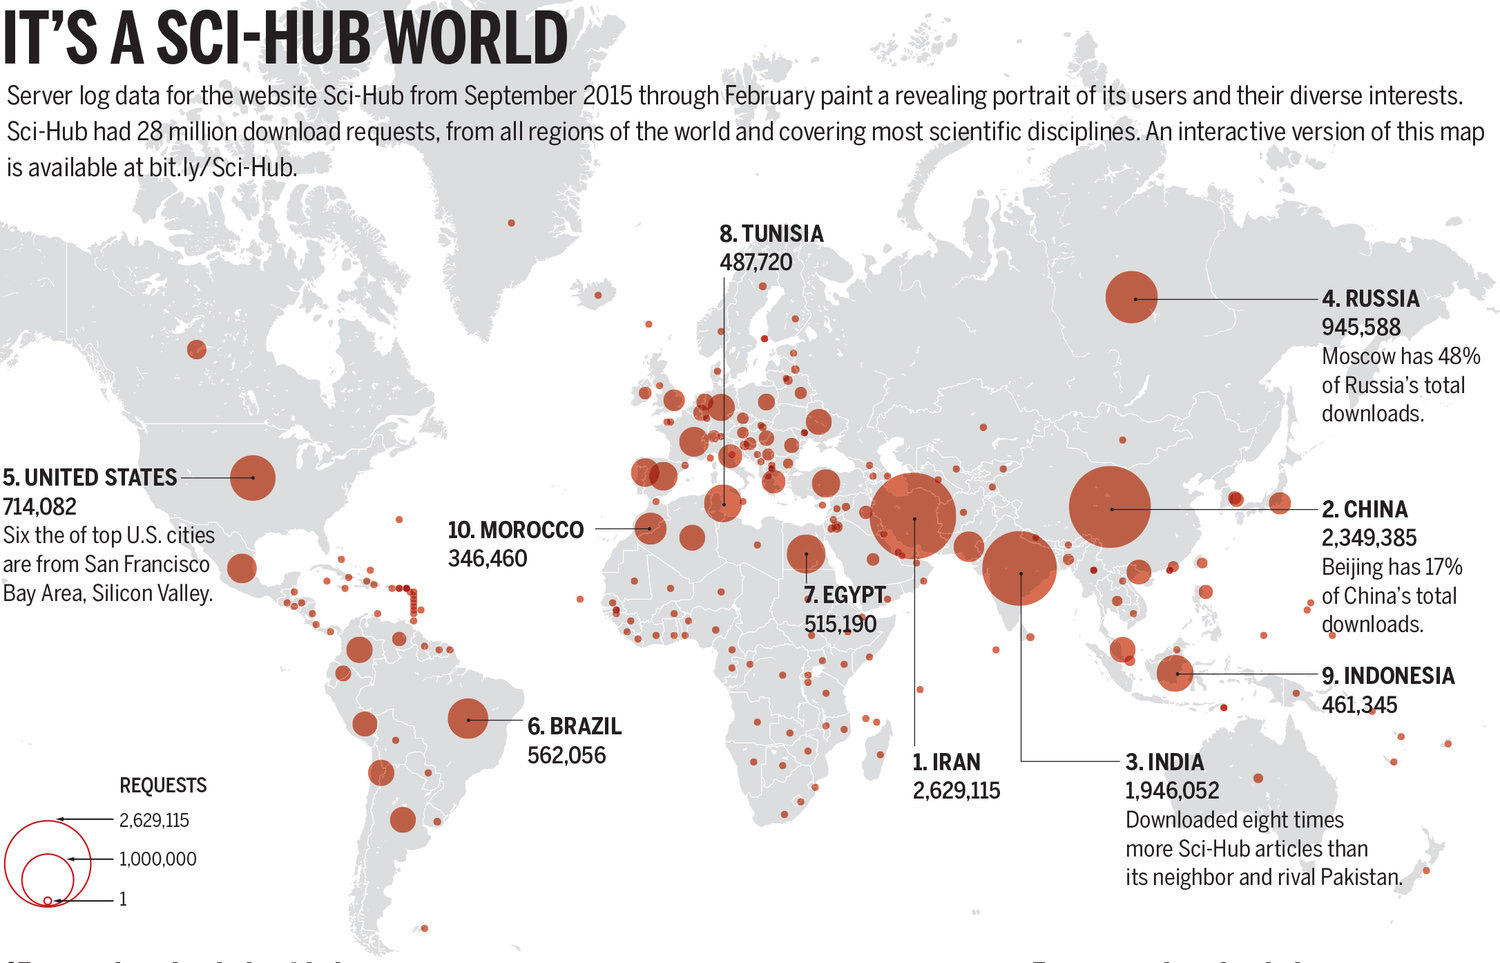
After we laid out all of the data, the patterns started to emerge. It was clear that Iran and China were, by far, downloading the most papers from around the world. We concluded that a symbol map would help make this information read very quickly, while also sharing what was happening in the rest of the world.
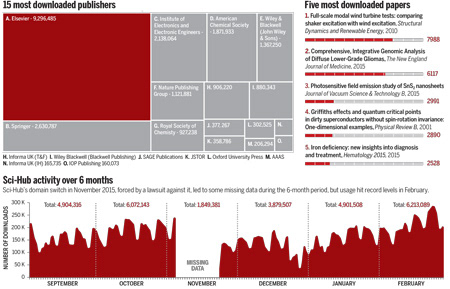
The data points to Elsevier as the most downloaded publisher by over half a million and a tree map really brings that point home. We also thought it would be interesting to plot the ebb and flow of traffic on the site - where you clearly see the drop off around the holidays.
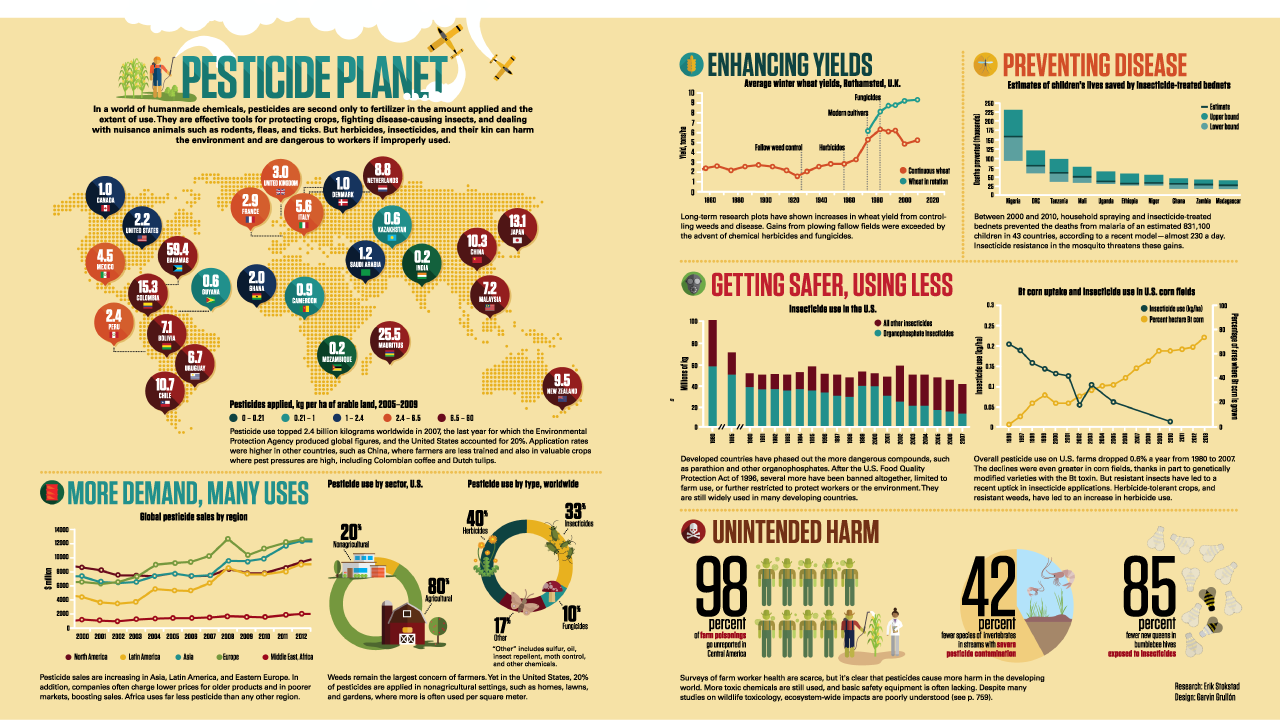
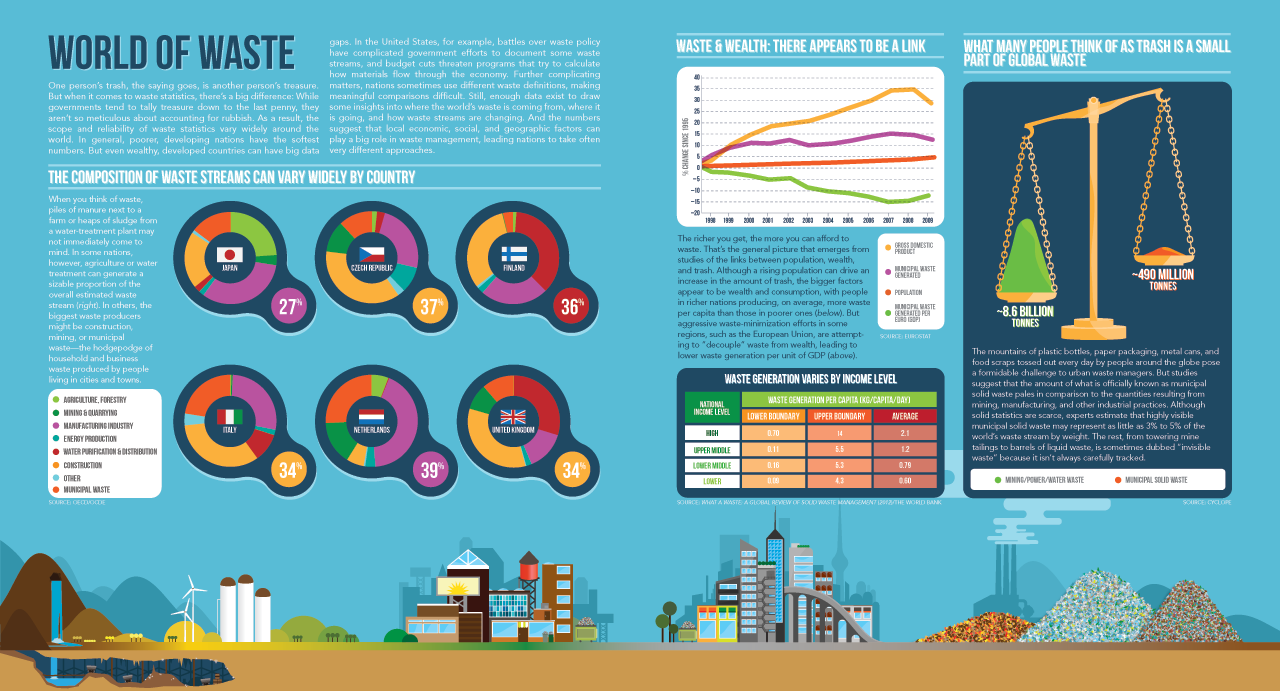
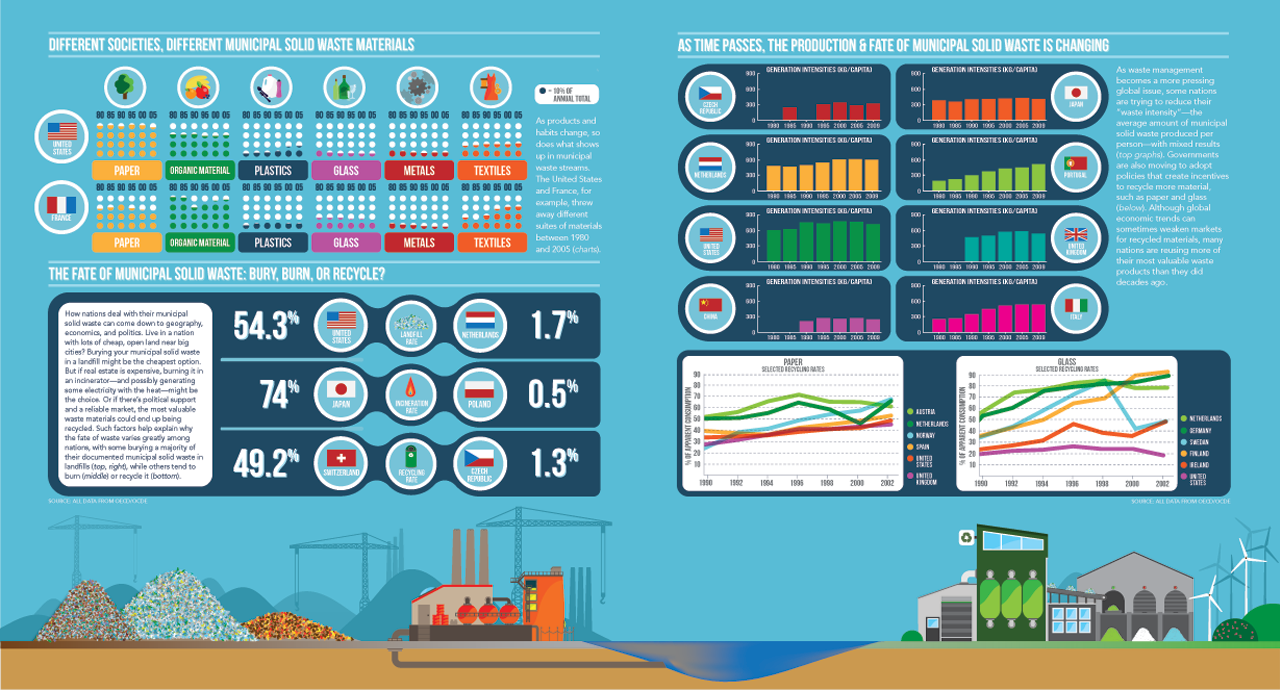
Colorful infographics designed for various Special Issues within the publication.
Publication Design
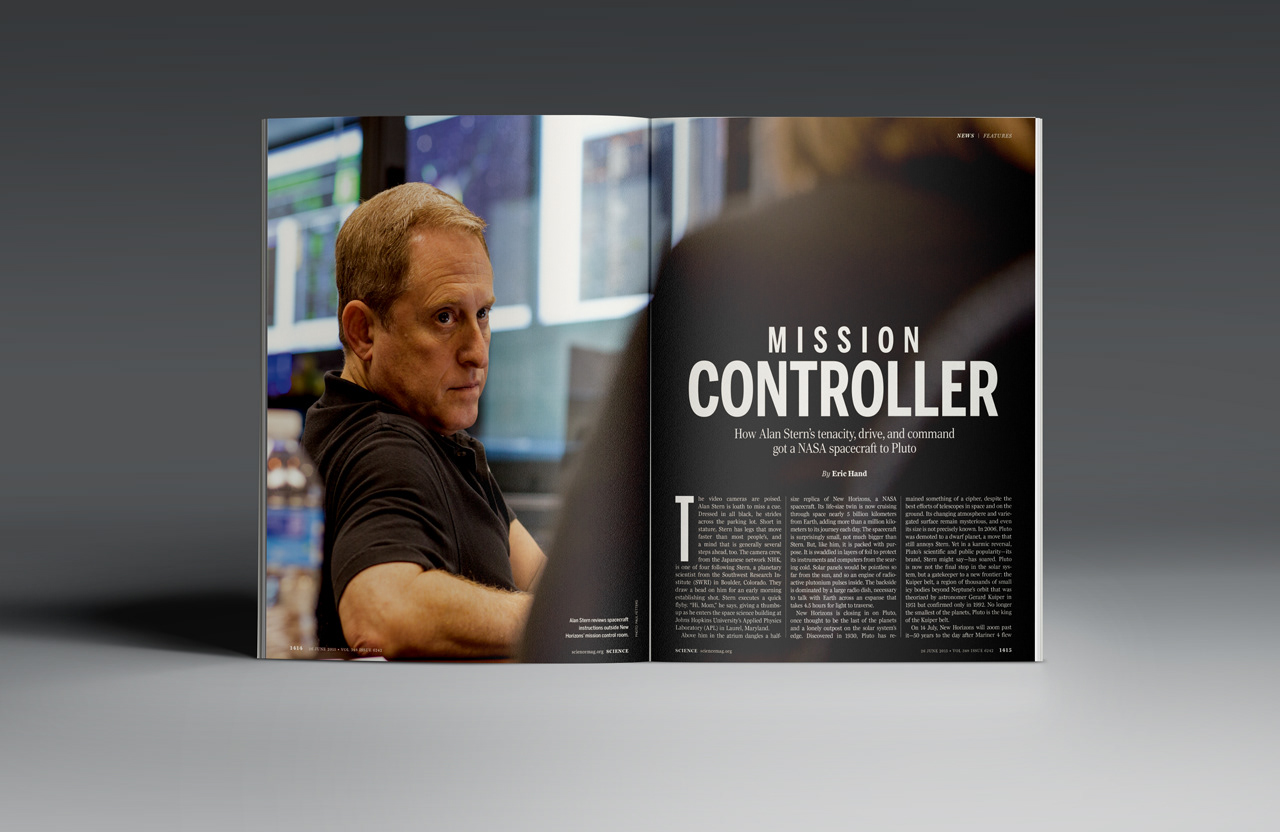

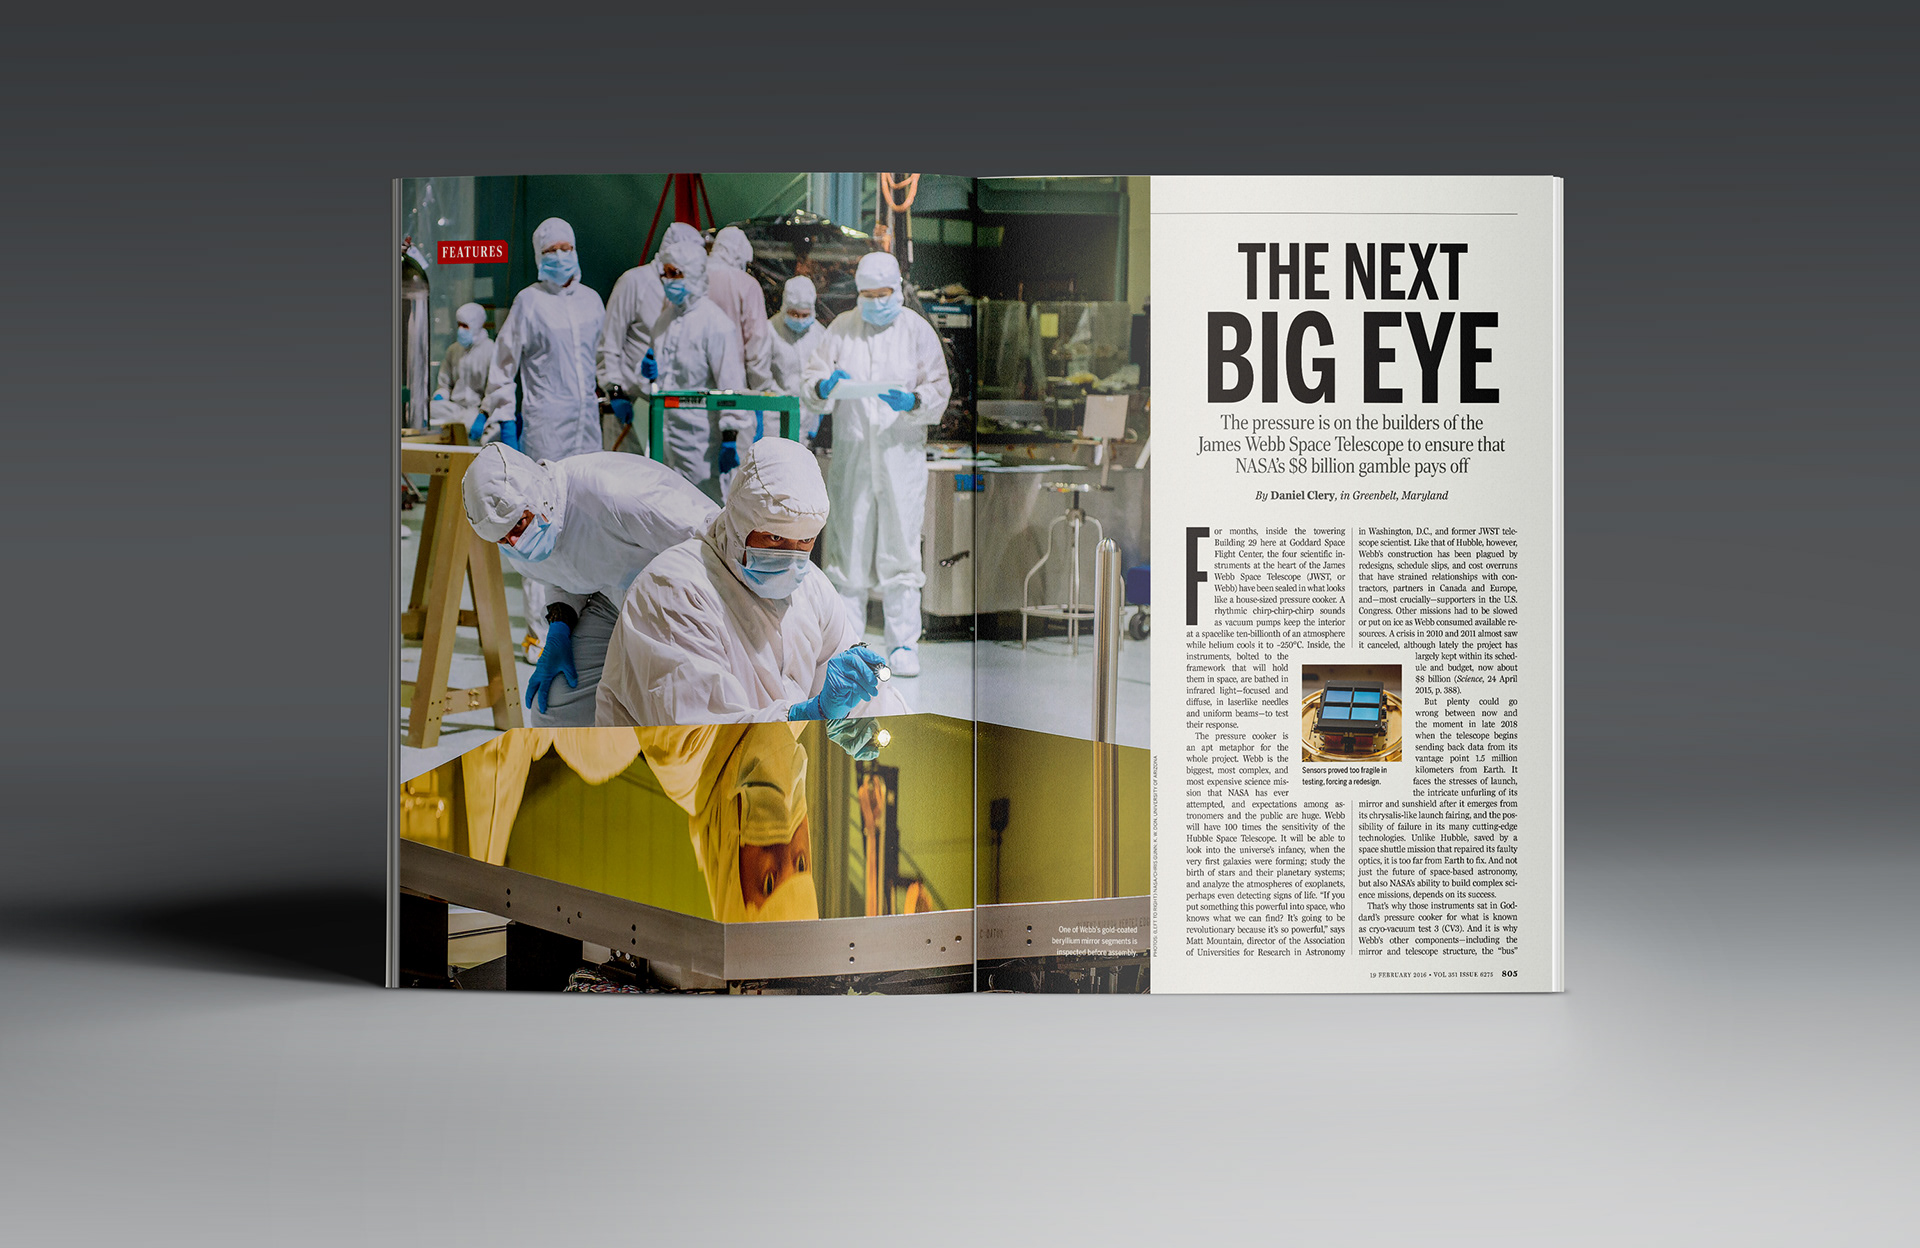
Managing Photo Editor: Bill Douthitt; Design Direction: Beth Rakouskas; Managing Graphic Editor: Alberto Cuadra; Design & Layout: Garvin Grullon
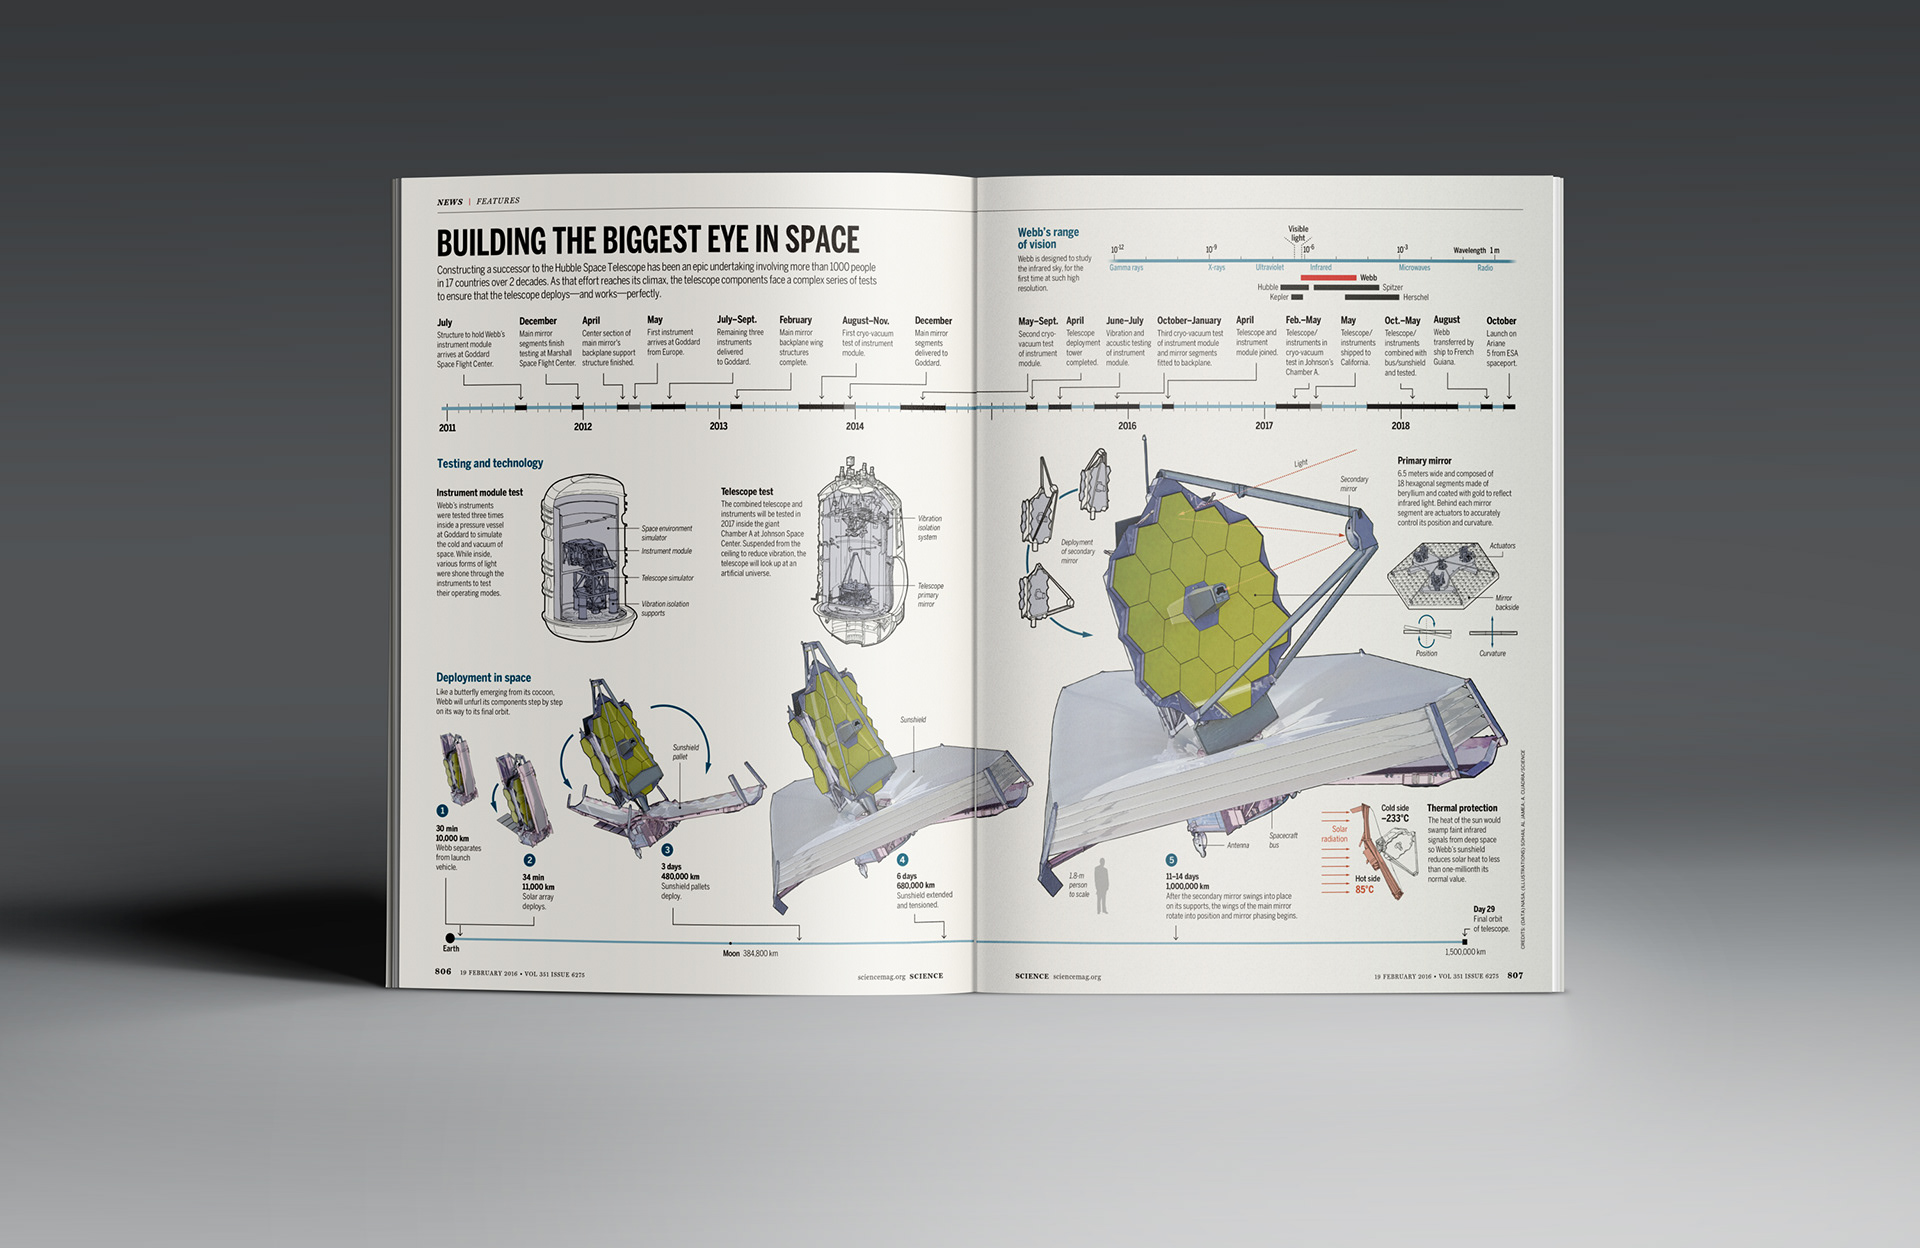
Technical Illustration
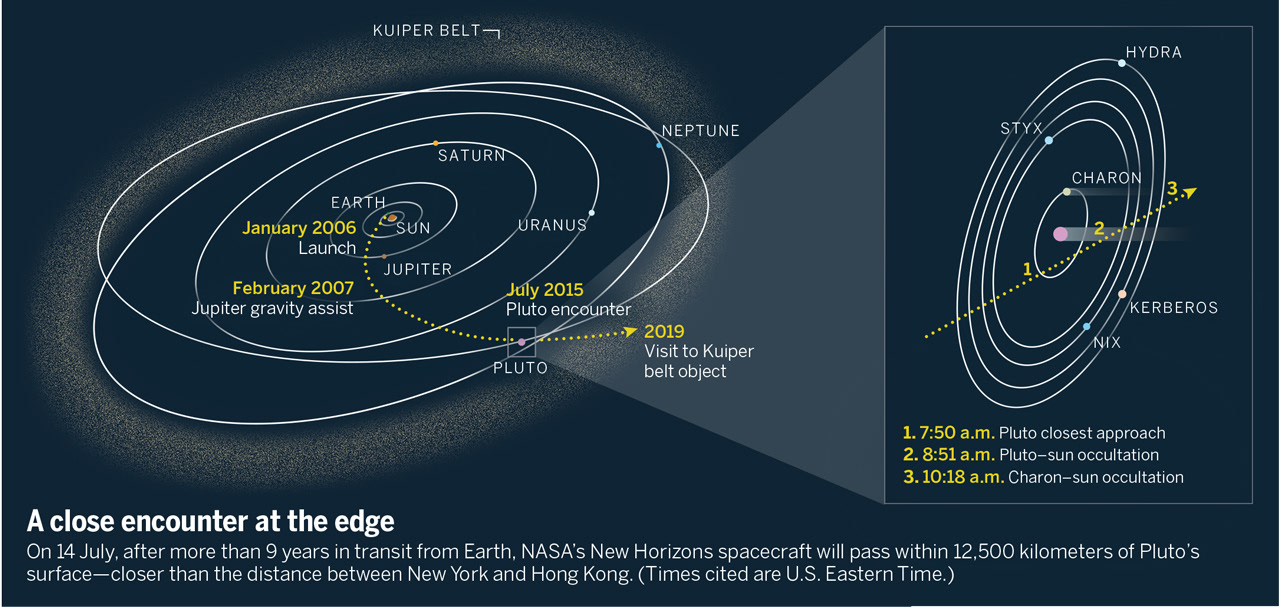
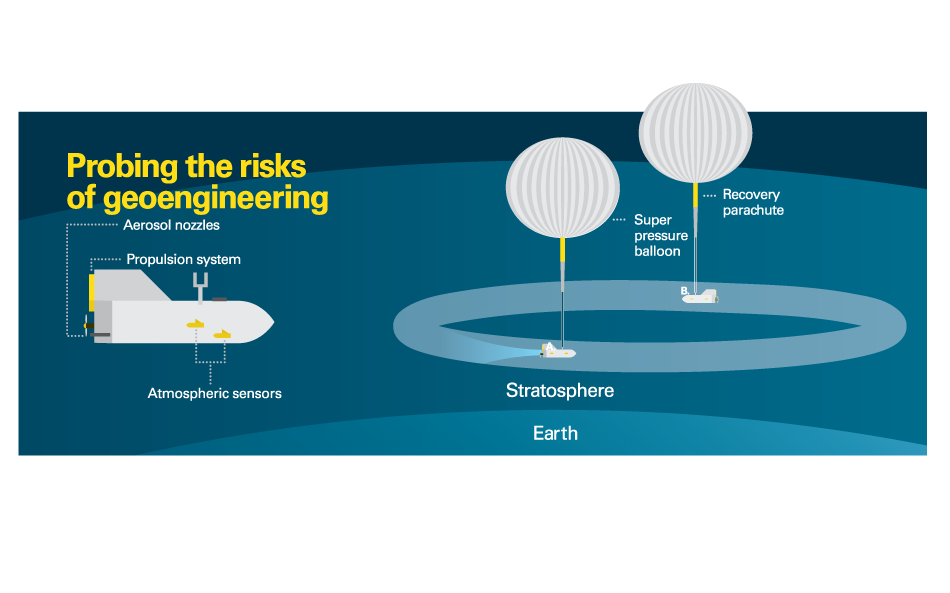


Combining my passion for data analysis with my love of Adobe Illustrator, I found myself captivated by the precision and technical skills required for creating diagrams and visualizations for a publication like Science. With the expert guidance of Design Director Beth Rakouskas and Managing Graphics Editor Alberto Cuadra, my proficiency in illustration and comprehension of data visualization saw substantial improvement, leading to my promotion to Graphics Editor in 2015.
Art Direction


In addition to overseeing the development and very specific photo research needed for covers across our secondary journals,
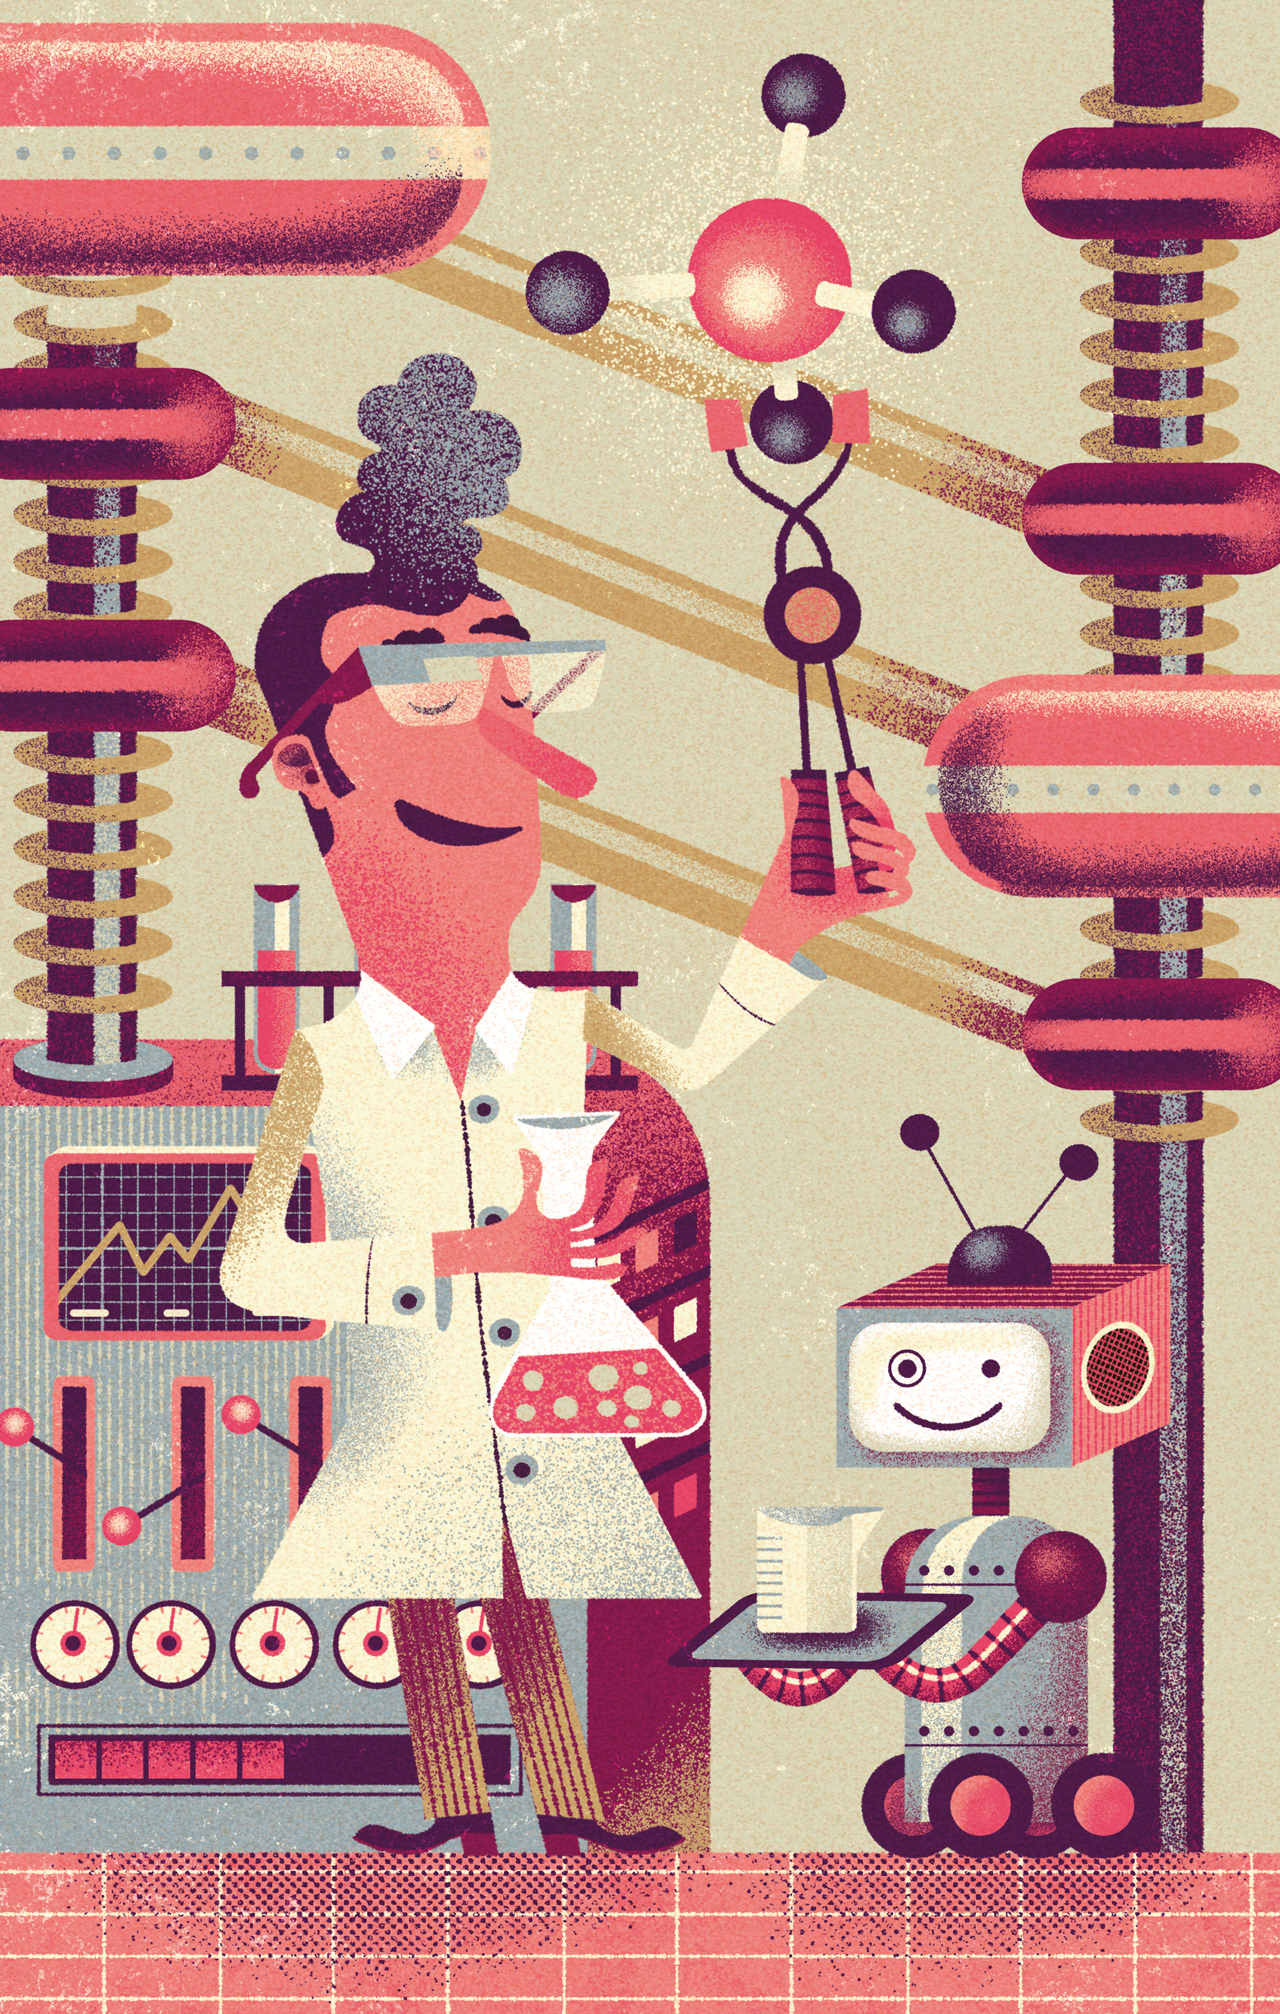
I frequently collaborated with editorial artists to produce illustrations for special issues.
I frequently collaborated with editorial artists to produce illustrations for special issues.